Scikit-learn Classification Metrics
Supervised Learning with scikit-learn
Beyond Accuracy
Definition of accuracy
Fraction of correctly classified samples.
Limitation of accuracy
For example, consider a model trained on a dataset where 90% of the samples belong to Class A and only 10% belong to Class B. If this model predicts Class A most of the time, it might still achieve a high overall accuracy simply because Class A samples dominate the dataset. However, such a model may perform poorly in accurately classifying samples from Class B.
In this scenario, the model’s apparent high accuracy is misleading because it does not adequately address the issue of class imbalance. >Class imbalance refers to the uneven frequency of classes1. This disparity can lead to models that perform well on the majority class but poorly on the minority class, thus failing to provide a reliable measure of the model’s overall effectiveness across different classes.
Techniques such as resampling the dataset, using different performance metrics are crucial to mitigate the effects of class imbalance and build a more robust model.
Exploring Additional Performance Metrics
Confusion Matrix (aka. Error Matrix)
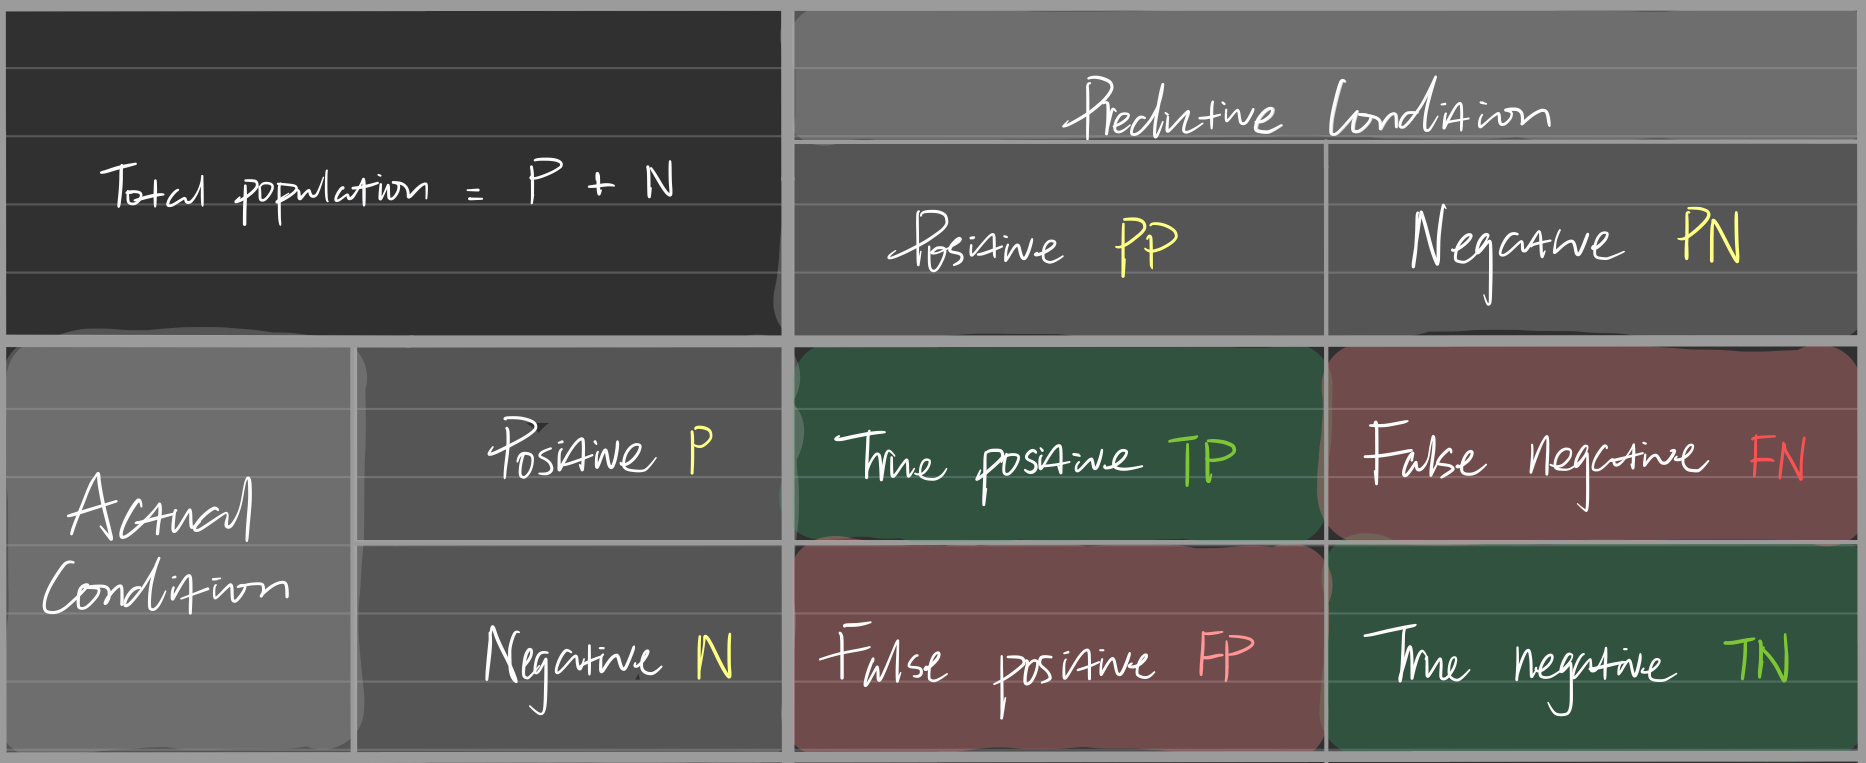
Confusion matrix: A table that summarizes the performance of a classification model by displaying the correct and incorrect predictions when compared to the true labels. This matrix is particularly useful for visualizing the performance of an algorithm, not just in binary classification but also in multi-class scenarios.
In a typical binary classification, the matrix categorizes predictions into 4 types of outcomes:
- True Positive (TP): Predictions where the model correctly predicts the positive class.
- True Negative (TN): Predictions where the model correctly predicts the negative class.
- False Positive (FP): Predictions where the model incorrectly predicts the positive class (also known as a “Type I error”).
- False Negative (FN): Predictions where the model incorrectly predicts the negative class (also known as a “Type II error”).
Each of these outcomes provides insight into different aspects of model performance:
- TP & TN indicate correct predictions made by the model.
- FP can be particularly costly in scenarios where false alarms are undesirable (e.g., medical diagnostics, spam detection).
- FN can be critical in situations where missing out on true positives can have severe consequences (e.g., failing to diagnose a serious disease).
This matrix excels at illustrating the performance of an algorithm. Below is an image demonstrating a possible visualization.
Class imbalance
Definition: Uneven frequency of classes
##
References
Supervised Learning with Scikit-Learn on DataCamp: https://app.datacamp.com/learn/courses/supervised-learning-with-scikit-learn. ↩︎